Analytical teams tend to concentrate on charts, KPIs, and SQL, but when the underlying schema is inconsistent or has grown too large, even basic queries end up being slow and unreliable. Proper database design means that data is stored only once, linked in a clear way, and can be retrieved quickly when preparing reports. This is the reason why many people taking a data analyst course in Bangalore come to realise that solid modelling skills have a direct impact on the speed of their dashboards.
Begin with the Business Questions and the Grain
Begin by deciding what the organisation wishes to measure: for example, revenue on a daily basis, conversion by channel, churn by cohort, inventory ageing, and so on. The requirements you establish will determine the grain—which is the finest level at which a measurable event is stored.
Practical checklist
- Find the main events: sales, payments, tickets, and sessions.
- Determine the grain (for example, ‘one row per order line’).
- Select stable keys to link the tables and to define the metric definitions.
When it is not clear what the grain should be, teams end up doubling up on the counts (for instance, they add up the order totals when the table is already at the item level). Having a well-defined grain stops such mistakes and ensures that the queries behave in a predictable way.
Normalization: Preventing Redundancy and Data Anomalies
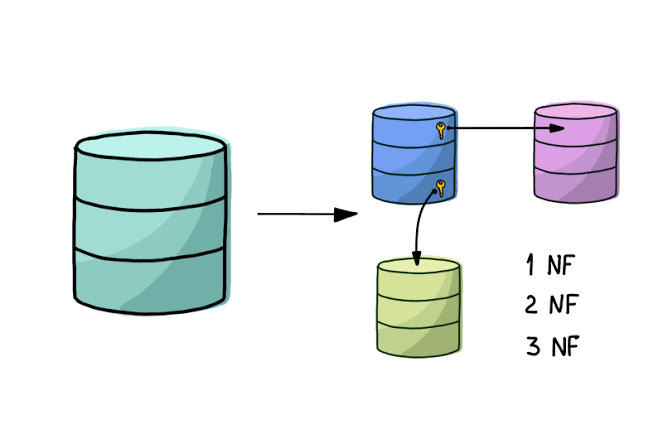
Tables are organised in a normalised way so that each fact is stored in a single location. The aim is to achieve consistency; if the city of a customer is listed in thousands of rows, a single missed update can lead to inconsistent results in various reports.
Normal forms in simple terms
- In the 1NF each column contains a single value.
- In the second normal form, the non-key columns depend on the entire key.
- In the third normal form, the non-key columns depend on nothing other than the key.
A common refactor is splitting a wide “Sales” table into separate Customer and Product tables, then referencing them via keys. Exercises like these appear frequently in a data analyst course in Bangalore because they mirror real “spreadsheet-shaped” data that needs to become durable database tables.
Schema Design for High-Speed Analytics: Star and Snowflake
Databases used for operational purposes (OLTP) have the advantage of being highly normalized since they involve frequent updates, while analytical systems (OLAP) are generally optimised for fast reading and for performing aggregations, which is why dimensional modelling is so commonly used.
Star schema (typical for dashboards)
A central fact table contains numeric measures (such as quantity, revenue, and duration); it is linked to dimension tables which give the relevant context (for example, date, product, customer, and region). This approach ensures that queries remain simple since the database scans the fact table and joins only those dimensions which are required for slicing.
Snowflake schema (more normalized dimensions)
Snowflaking splits certain dimensions into sub-tables (for example, Product → Category, Geography → Country/State/City). While it can ensure consistency it does introduce joins. In practice, it is best to denormalize descriptive attributes which are frequently used in reporting and to normalize those attributes which change independently or are used by many entities.
PhysicalPerformance consists not only of logical modelling; it is the physical choices that determine how quickly the database can locate and aggregate the data.ickly the database can locate and aggregate data.
Make joins and filters cheap
- Add indexes to foreign keys used for joins, such as customer_id and product_id.
- The index columns employed in the filters are order_date and region.
- It’s not necessary to index everything since too many indexes can slow down writes.
Partition large fact tables
By dividing the data (typically by date), queries such as ‘the last 30 days’ only need to search the more recent partitions rather than the entire history, which can therefore greatly speed up the response times when dealing with large datasets.
Protect quality with constraints
Primary keys stop duplicates occurring, foreign keys guard the relationships, and check constraints ensure that the values are within the valid range. Having strong constraints means that there is less cleaning work needed further down the line and the metrics remain stable.
Mini Example: A Sales Model That Scales
For e-commerce analytics, a simple model might be:
- fact_sales: date_key, customer_key, product_key, channel_key, quantity, net_revenue
- dim_customer: customer_id, signup_date, segment, city
- dim_product: sku, category, brand
- dim_date: day, month, quarter, year
- dim_channel: source, campaign
The structure enables quick responses to queries regarding revenue by month and category at the same time as it retains the descriptive data in the appropriate location. It is a fundamental ability that is expected of analysts, whether they are taking a data analyst course in Bangalore or are working with warehouse-ready datasets.
Conclusion
Efficient analytics depend on good database design and normalization. In order to avoid duplication and inconsistent updates, you should normalize and then apply dimensional modelling to optimize performance for read-heavy workloads. The schema should be strengthened with the use of indexes, partitioning, and integrity constraints so that large datasets stay both fast and reliable. As long as the schema addresses the business questions and maintains clear relationships, analytical retrieval will be both quick and dependable.